Your local Google rank, mapped block by block
Local rank is not one number — you rank differently three streets away. The Visibility Map runs a geo-grid of real Google ranking checks across your service area so you can see exactly where you win the map and where a competitor owns it.
Free AI-visibility scan · No credit card · Cancel anytime
Set up in 3 simple steps
We grid your service area
Your city becomes a block-by-block grid centered on your business — Starter covers your core grid plus one ZIP area, Growth covers five, and more are $10/mo each.
Real checks run from every block
Each point on the grid gets a real local ranking check for your tracked keywords — the position an actual searcher standing there would see.
The map shows where you win and lose
Strong blocks, weak blocks, and — on Growth — who outranks you in each neighborhood. The monthly work then targets the weak blocks specifically.
One number for a whole city
- A single "we rank #3" hides that you are invisible two miles out
- Service-area money spent where you already win
- No way to see a competitor owning a specific neighborhood
- Local proximity — the heavyweight signal — goes unmeasured
With the Visibility Map
- Your real position from every block of your service area
- Weak neighborhoods identified — and targeted by the monthly work
- Growth shows who outranks you, block by block
- Coverage grows with you: ZIP areas at $10/mo, keywords at $2/mo
What you get
- A grid of real ranking checks across your neighborhoods
- See where you rank #1 — and the blocks where you are invisible
- Citywide ZIP coverage available as an add-on
- Recheck cycles show the map changing as the work ships
How it works
We plot a grid across your service area and run genuine local queries from each point. Every cell shows your real position for that spot, so "we rank #3" becomes "we rank #1 north of the freeway and #9 near the beach — here is what to fix."
The map tracks Google local rankings. Your AI visibility is tracked separately by the AI Visibility Tracker — the two are different value props and we never blur them.
Proximity is the signal single numbers hide
Google reshuffles local results by where the searcher stands — your rank two blocks from your door and your rank across town are different answers to the same search. Averaging them into one number destroys exactly the information a service business needs: WHERE the next customer can and cannot find you.
The grid preserves it. Each cell is a real check from that location, so the map reads like territory — the blocks you own, the blocks a competitor owns, and the frontier between. That frontier is where marginal work pays best, which is why our content and profile work aim there first.
What moves a weak block
Block-level weakness usually has block-level causes: no service-area page naming that neighborhood, thin profile signals for that part of town, a competitor with denser reviews nearby. The playbook is correspondingly specific — a landing page for the area, profile posts that name it, citations that anchor your service radius.
Movement shows up on the next scans as the weak cells warm. It is slower than a slogan and faster than doubt: most service businesses can read their own trend inside a couple of cycles, on a map instead of a promise.
From map to monthly plan
The map is not decoration — it is the queue. Weak blocks get ranked by the business value behind them (demand in that area, proximity to your base, competitor density), and the month’s landing pages, profile posts, and citations are aimed down that list. When the work ships, the portal timeline shows which blocks it targeted.
That closes the loop most tools leave open: measurement that never becomes assignment. Here the same subscription owns both halves, so a red block is not a verdict — it is next month’s job, visibly scheduled, and the following scan grades how well the job worked.
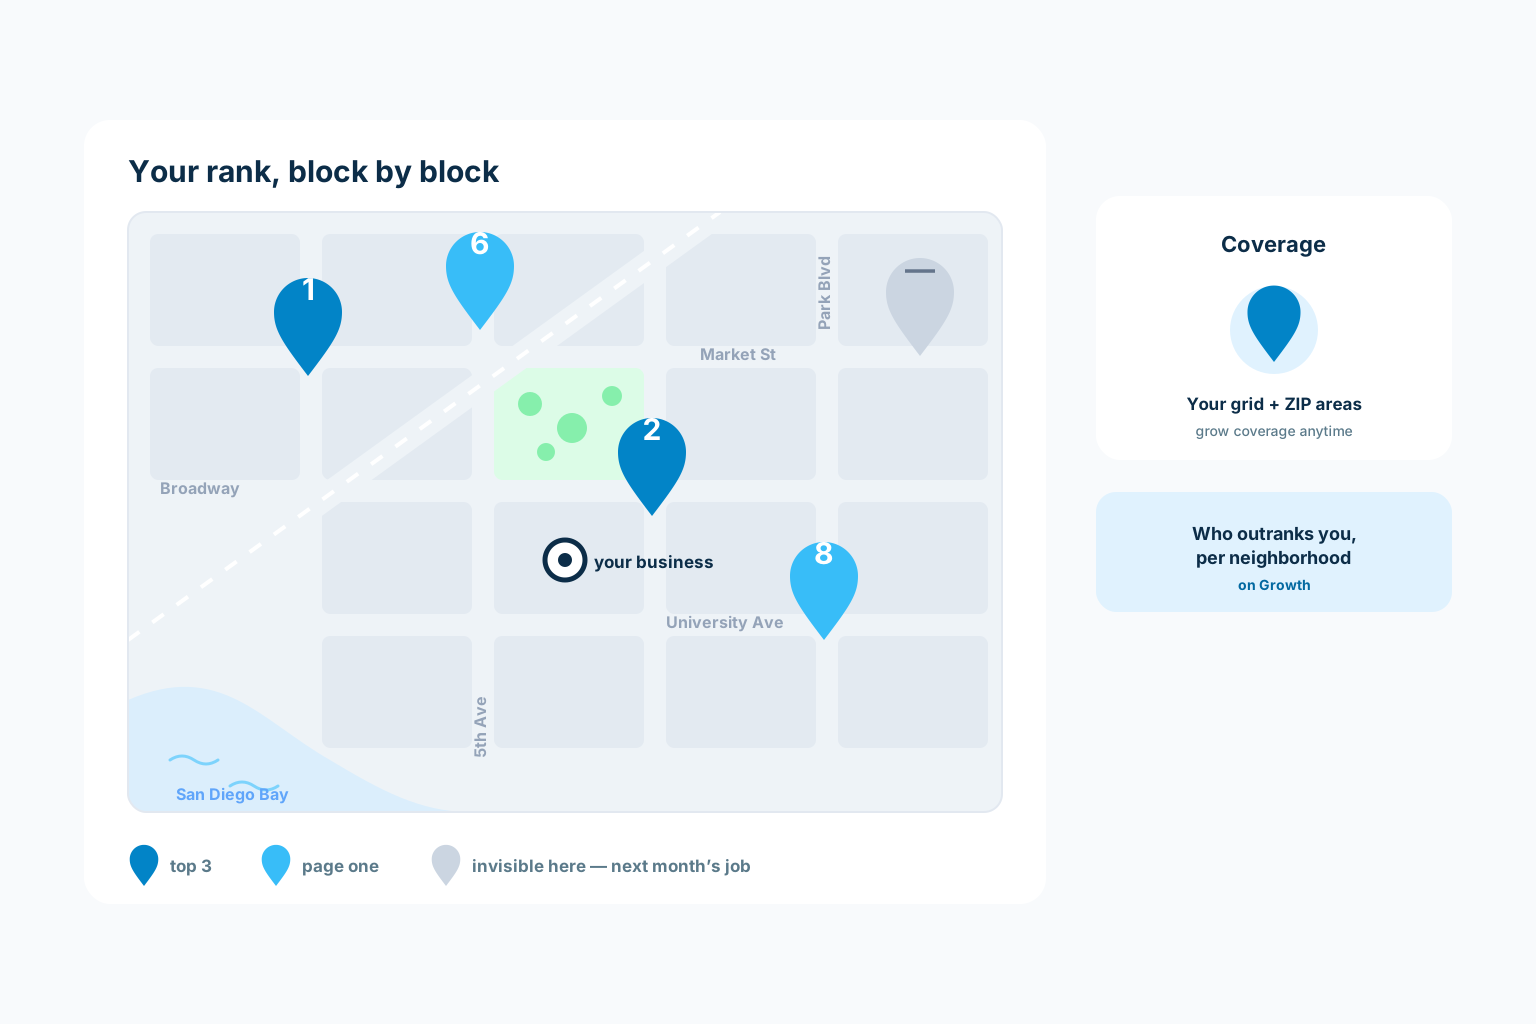
Your service area, block by block
One shade per area: strong, visible, or not yet. The map turns "how do we look around town?" into something you can point at — including the neighborhoods where customers searching right now cannot find you.
- Real scans across your service area
- Strong and weak zones at a glance
- Every scan stored — coverage has a history
Illustrative layout — decorative shapes, not data. Your real numbers come from your scans, stored verbatim in your portal.
From map to work list
A weak zone is not a verdict, it is a queue. The areas where you are invisible become the priorities for the content, profile, and citation work your plan ships each month — and the next map shows whether the shade changed.
- Weak zones become the work queue
- Rescanned on schedule, so progress is visible
- Coverage trend, not anecdotes
Illustrative layout — decorative shapes, not data. Your real numbers come from your scans, stored verbatim in your portal.
Visibility Map FAQ
What is a local rank tracker map and why does one number lie?
Local rank changes street by street — you can be #1 downtown and invisible two miles away. A geo-grid tracker runs real queries from points across your area and maps the true picture instead of one misleading average.
How does a Google Maps rank checker work?
It runs genuine local searches from fixed geographic points and records where your business appears at each one. ClawSignal plots those checks as a grid over your service area and re-runs them so you can watch the map change.
How is a rank map different from normal rank tracking?
Normal tracking gives one position per keyword; the map gives that keyword’s position from every block of your service area. For proximity-driven local results, the geography IS the ranking — one number per city hides it.
How much service area does each plan cover?
Starter maps your core block-by-block grid plus one ZIP area; Growth covers five ZIP areas and adds who outranks you per neighborhood. Additional ZIP areas are $10/mo and extra tracked keywords $2/mo, tracked consistently across all your areas.
More features
Put Visibility Map to work
Start with a free scan. ClawSignal finds the strongest opportunity, prepares the work, and keeps every change behind your approval.